LinkedIn creator dashboard: what to check first
LinkedIn's new creator dashboard puts analytics, drafts and scheduled posts in one place. See what is new, what is missing, and what to check weekly.

LinkedIn's new creator dashboard is a single page that brings your analytics, drafts, scheduled posts and earning programmes together. It is rolling out worldwide over the coming weeks, so you may not see it yet.
The numbers inside are mostly the ones you already had. This guide explains what changed, what to check each week, and the one thing the dashboard does not show.
What is LinkedIn's new creator dashboard?
On 15 October 2026 LinkedIn announced a new Dashboard "with everything creators need in one place". It helps creators see what is working, manage content and find ways to earn.
On mobile, LinkedIn says you open it by tapping your profile picture at the top left of the app. It "will roll out globally in the coming weeks".
LinkedIn says more than 80% of its creators build content alongside another role. That describes a lot of founders and consultants: busy people who post between client calls.
Is anything new in the numbers?
Not at launch, as far as we can tell. LinkedIn's announcement names no new metrics. A third-party review by Composeur reads it the same way: the announcement is about where you read the numbers, not about new numbers. That is our reading too, and it could change if LinkedIn adds more later.
The analytics that exist today are described on LinkedIn Help. They fall in two groups:
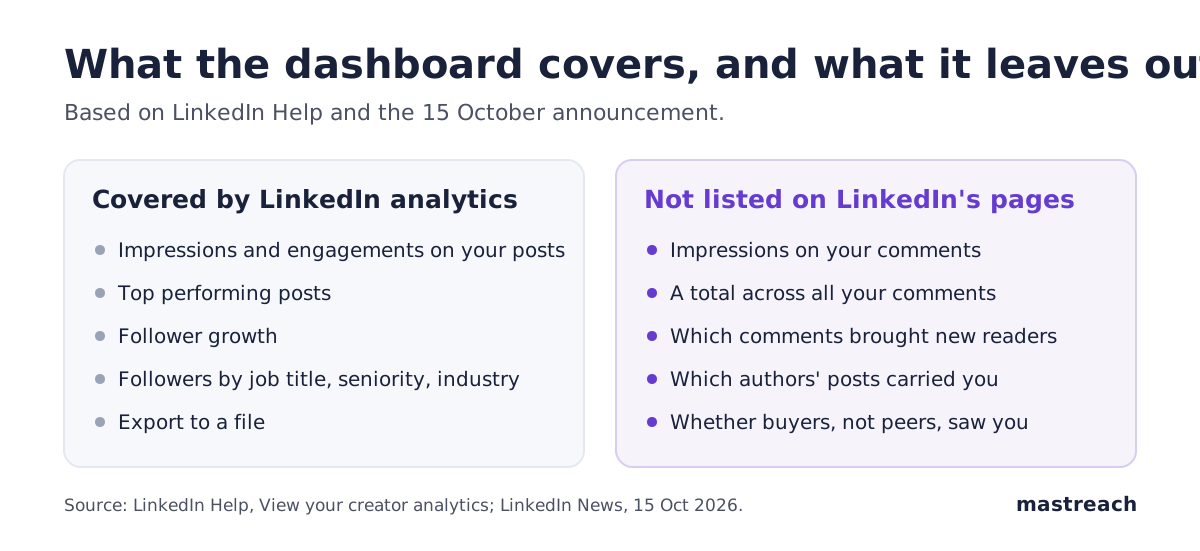
- Content analytics: how your posts, images, videos, events, polls and articles perform over time. You can pick impressions or engagements, see your top performing posts and export a file.
- Audience analytics: follower growth, and a breakdown of followers by job title, location, industry, seniority, company size or company.
The dashboard is also where LinkedIn points to its earning programmes. Most are limited. Advice Sessions are for Business Premium subscribers in the US. In-Stream Ads are a test with select US creators. If you are in the UK, Europe, the Gulf, Australia or India, treat these as news to watch, not a plan. Our article on whether Premium All-in-One is worth it covers the paid side in more detail.
Why might you not see it yet?
Because LinkedIn is releasing it gradually and has given no dates by country. Not seeing it today does not mean your account is excluded or in trouble.
LinkedIn's Help page for analytics also says some features are "gradually" made available and that some are on desktop only for now. If the dashboard is missing, use the Analytics section of your profile. The same data is there.

Which numbers show whether buyers are reading you?
For a consultant or small firm, the audience breakdown matters more than the impression total. A post can reach 10,000 people and not one of them can hire you.
Open audience analytics and switch the top demographics between job title, seniority and industry. LinkedIn shows the top five in each view. Then ask three plain questions:
- Do the job titles match the people who pay you? A Dubai property adviser wants developers and investors. A UK HR consultant wants HR directors. If your top five titles are other consultants, you are mostly reaching peers.
- Is seniority right? A US agency owner selling to marketing leaders wants directors and VPs near the top.
- Is the industry right? Even one wrong industry in the top five is a clue about who your posts attract.
Do not panic over one view. This shows who follows you, not who read last week. Our reading is to use it as a compass, not a scorecard.
What does the dashboard not show about your comments?
LinkedIn's analytics description covers posts, images, videos, events, polls and articles. It does not list comments. That matters because comments are often how a new buyer first meets you.
We see the gap in our own data. Between August and September 2026, comments drafted in Mastreach and then posted earned 177,931 impressions across 914 comments, about 195 per comment. LinkedIn shows the impression count under each comment, one at a time, and totals them nowhere.
Two cautions. Impressions are not unique people, and repeat views and your own views count. We also have no before-and-after comparison for these accounts. So treat the figure as a measure of exposure, not proof of clients. Our article on where to find comment impressions shows how to read them by hand.
How should a consultant review it each week?
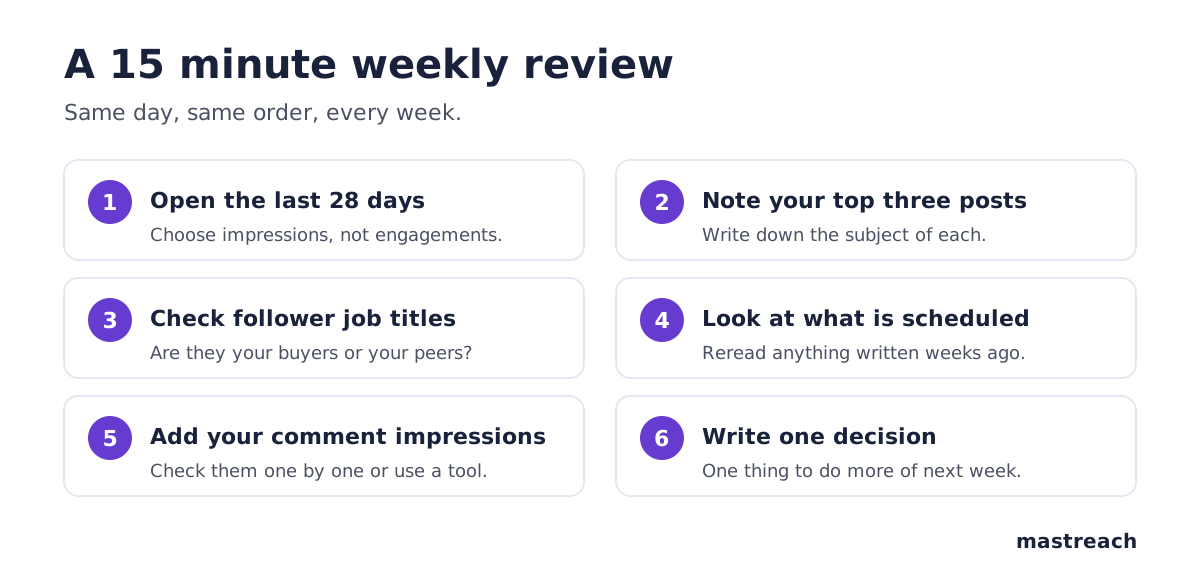
Keep it short. Fifteen minutes on the same day each week beats a long review once a quarter. Use the same order each time so you can compare weeks fairly.
A few habits keep the numbers useful:
- Compare yourself with yourself. Use the last 28 days and compare posts of the same kind. One viral post tells you little.
- Judge by subject. Note what your top three posts were about. If they match the problem you solve, keep going.
- Check scheduled posts. With drafts and scheduled posts side by side, reread anything written weeks ago. Facts and offers go stale.
- Make one decision. Write one thing to do more of next week. Not five.
LinkedIn is also testing a separate Network feed in the US, India, the UK and Australia. Our article on the Network feed test explains what that could mean for who sees your posts.
Where Mastreach fits
The dashboard tells you how your own posts did. It does not tell you what your comments on other people's posts earned, and for many busy founders that is where new buyers first notice them.
Mastreach covers that gap:
- It shows LinkedIn posts in your subject that your buyers are reading.
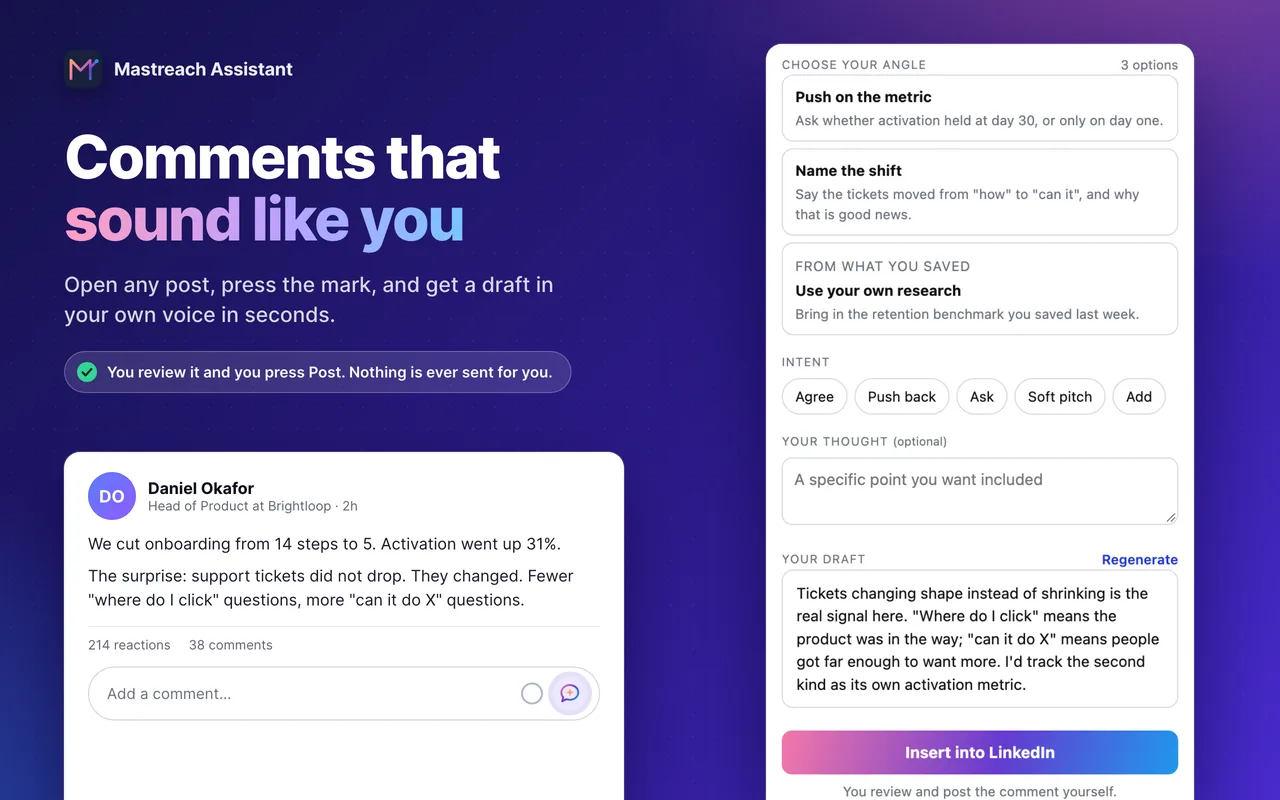
- It drafts a comment in your own voice, from an angle you pick.
- It records the impression count LinkedIn shows under each comment and adds them up by week.
You read, edit and post every comment yourself. Mastreach never posts or messages for you. Plans start at $29 a month (Rs 1,500 in India), with a 5-day free trial.
FAQ
Is the LinkedIn creator dashboard available to everyone?
Not yet. LinkedIn says it will roll out globally in the coming weeks and has not given dates by country. Until it appears, the same analytics are in the Analytics section of your profile.
Does the dashboard show comment impressions?
LinkedIn's analytics description lists posts, images, videos, events, polls and articles, not comments. In our experience, comment impressions are visible only under each comment, one at a time.
Will using the dashboard or scheduling posts improve my reach?
Nothing LinkedIn has published says so. The announcement does not link the dashboard to how posts are distributed. Treat it as a tidier place to read your numbers.
Can I make money through the dashboard outside the US?
Mostly not yet. LinkedIn describes Advice Sessions as available to Business Premium subscribers in the US, and In-Stream Ads as a test among select US creators.
Sources
See what your own comments are reaching.
Mastreach finds the LinkedIn posts your buyers are reading, drafts a comment in your voice, and counts the impressions LinkedIn never adds up for you. You post every comment yourself.
- 914 comments drafted with Mastreach and posted by their owners
- 177,931 LinkedIn impressions on those comments, August to September 2026